Fig. 5. AMPK signaling gene expression profile analysis in kidney (A) and heart (B) of control and T1DM animals. Values represent fold change of STZ-treated vs control animals. Red spots are upregulated genes; Green spots are down regulated genes.
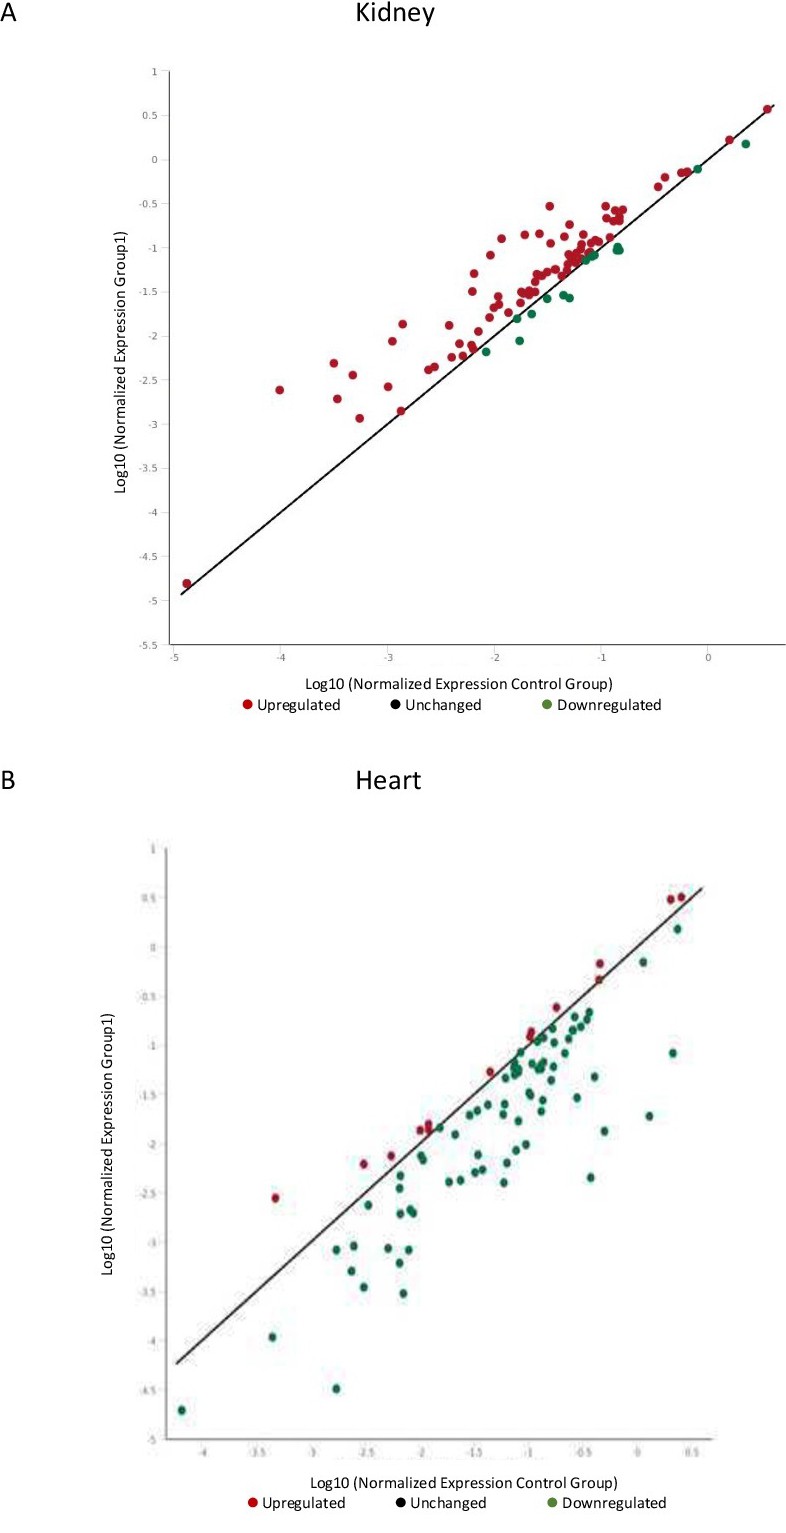
Fig. 5. AMPK signaling gene expression profile analysis in kidney (A) and heart (B) of control and T1DM animals. Values represent fold change of STZ-treated vs control animals. Red spots are upregulated genes; Green spots are down regulated genes.